
Trending · Low
Direction Negative empirical association
Not supported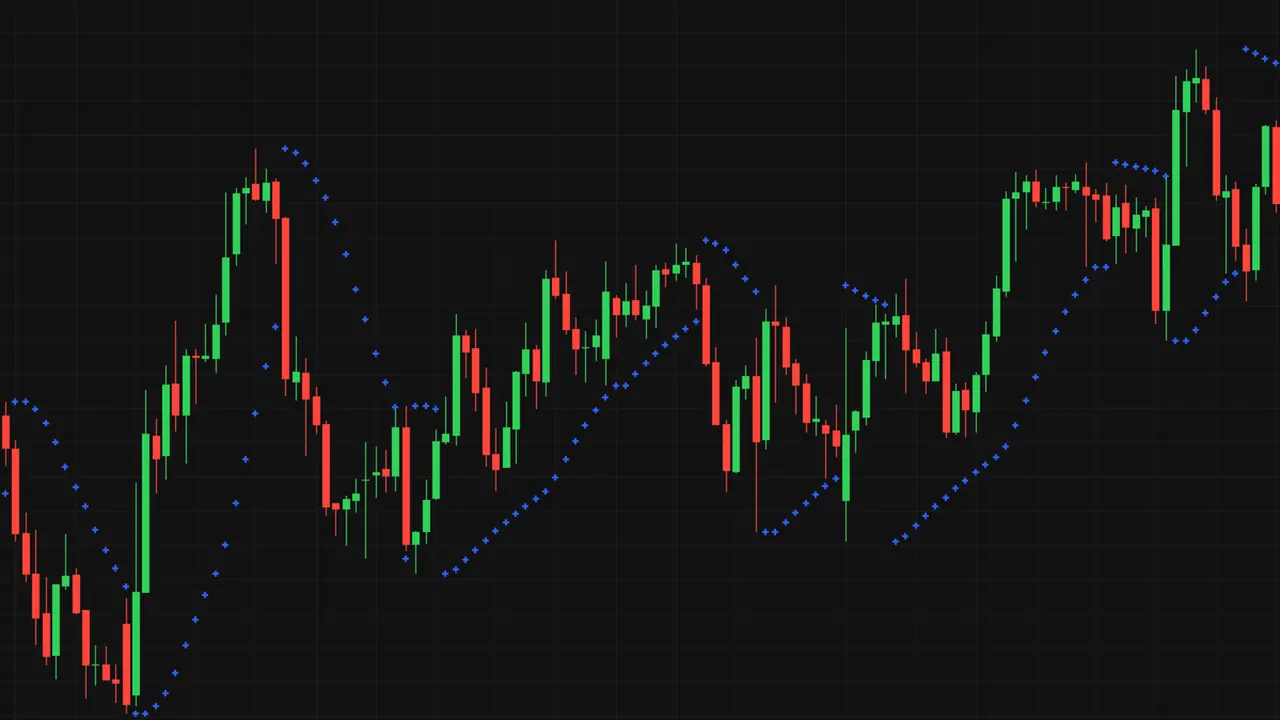
RESEARCH PROFILE
8 instruments · 4 timeframes
Lead example: USD_JPY M5 · not universal
EDITORIAL TAKEAWAY
Scope sensitivity is the clearest cross-scope finding.
Parabolic SAR showed different research results across the complete 32-scope set: a measurable association was present in 5 scopes, while 27 had no measurable association. 2 scopes showed at least one supported regime. The evidence therefore does not support one universal trading relationship.
PARAMETER ROBUSTNESS
No valid public indicator-level parameter-robustness summary is available for this profile. Malformed or contradictory evidence is not rendered, and the authoritative overall verdict remains unchanged.
WHAT WAS MEASURED
ASSOCIATION PROFILE
Association varies across measured scopes: 5 of 32 showed a measurable association, while 27 of 32 showed none. Because the observed range crosses zero, the supplied evidence does not support one universal directional relationship.
The distribution describes the supplied information bands across measured scopes; it is not one universal rating for the indicator.
The average observed association summarizes the supplied measured values. It is descriptive, not a prediction score, probability, profitability score, recommendation, or indicator-quality rating.
IC is a descriptive association measure between the indicator output and subsequent returns. It is not a prediction score, probability, profitability measure, recommendation, or indicator-quality rating.
Exact supplied values: minimum -0.118392; maximum 0.028875; mean -0.0540936.
WHAT WAS NOT MEASURED OR VALIDATED
This Research Profile did not repeat a direct reference-chart comparison for every measured scope. The authoritative chart-match result above remains separate; not included here does not mean chart reproduction failed.
This is the supplied cross-scope research classification when available. Output-level parameter robustness remains a separate evidence type shown above.
No aggregate timing conclusion is available for the full scope set.
REGIME SUPPORT
30 of 32 measured scopes had no supported regime.
2 of 32 measured scopes had at least one supported regime.
These supported-regime counts are evidence-threshold outcomes, not trading rules.
A supported regime means the existing evidence threshold was passed for that market condition. It does not establish a trading rule, recommendation, or universal behavior.
TRACEABILITY EXAMPLE
These are descriptive directional observations for one example scope. They do not summarize all measured scopes.
Direction Negative empirical association
Not supportedDirection Negative empirical association
Not supportedDirection Negative empirical association
Supported · not validatedDirection Negative empirical association
Not supportedDirection Positive empirical association
Not supportedDirection Negative empirical association
Not supportedTECHNICAL DETAILS
Coverage describes what was measured. It does not mean every scope showed the same relationship or predictive validity.
Instruments: AUD CAD, DE30 EUR, EUR USD, GBP JPY, GBP NZD, USD CHF, USD JPY, XAU USD
Timeframes: M5, M15, H1, H4
Explicit scope inventory: AUD CAD H1, AUD CAD H4, AUD CAD M15, AUD CAD M5, DE30 EUR H1, DE30 EUR H4, DE30 EUR M15, DE30 EUR M5, EUR USD H1, EUR USD H4, EUR USD M15, EUR USD M5, GBP JPY H1, GBP JPY H4, GBP JPY M15, GBP JPY M5, GBP NZD H1, GBP NZD H4, GBP NZD M15, GBP NZD M5, USD CHF H1, USD CHF H4, USD CHF M15, USD CHF M5, USD JPY H1, USD JPY H4, USD JPY M15, USD JPY M5, XAU USD H1, XAU USD H4, XAU USD M15, XAU USD M5
HOW TO READ THIS PROFILE
This is secondary research evidence. It adds context to the indicator page without replacing the authoritative verdict or changing publication status.
$ na get parabolic-sar
where this indicator runs, and how you get it
Runs on TradingView, so there is nothing to install. Open the published script and add it to any chart in your account — you always load the version currently published by its author.
A verdict separates reproducibility from market evidence, then asks whether that evidence remains reliable under broader checks.
Can we reproduce the indicator’s published calculation?
Does it show a measurable historical market relationship?
Does that relationship survive different conditions, market series, and nearby settings?
Verified only when the required checks finish without a blocking result.
Chart match confirms we evaluated the same indicator. It does not prove profitability. Verification depends on whether the measured relationship is reliable and robust.
Verdicts summarize historical measurements. They are not forecasts, endorsements, promises of profitability, or trading advice.
Declared characteristics and source metadata come from the indicator record, not from the engine verdict.
These checks describe different parts of the evidence process; none is a standalone claim of future performance.
Every indicator is documented under the same spec contract. Browse the full library to compare tools across markets and timeframes.
$ ls ./related
others from the desk
Charts shown on this page are by TradingView. TradingView® is a registered trademark of TradingView, Inc. TradingView® has no affiliation with NeuronAlgo.
Questions? We typically respond within a few hours.
We typically respond within a few hours.
Or browse
Help Center Guides & support articles FAQ Answers to common questionsReal humans, real time. Typically replies in under a minute.
Support is onlinePrefer email?