NeuronAlgo
~/indicators/williams-rlive
Indicator

Williams %R

RenderingOscillator
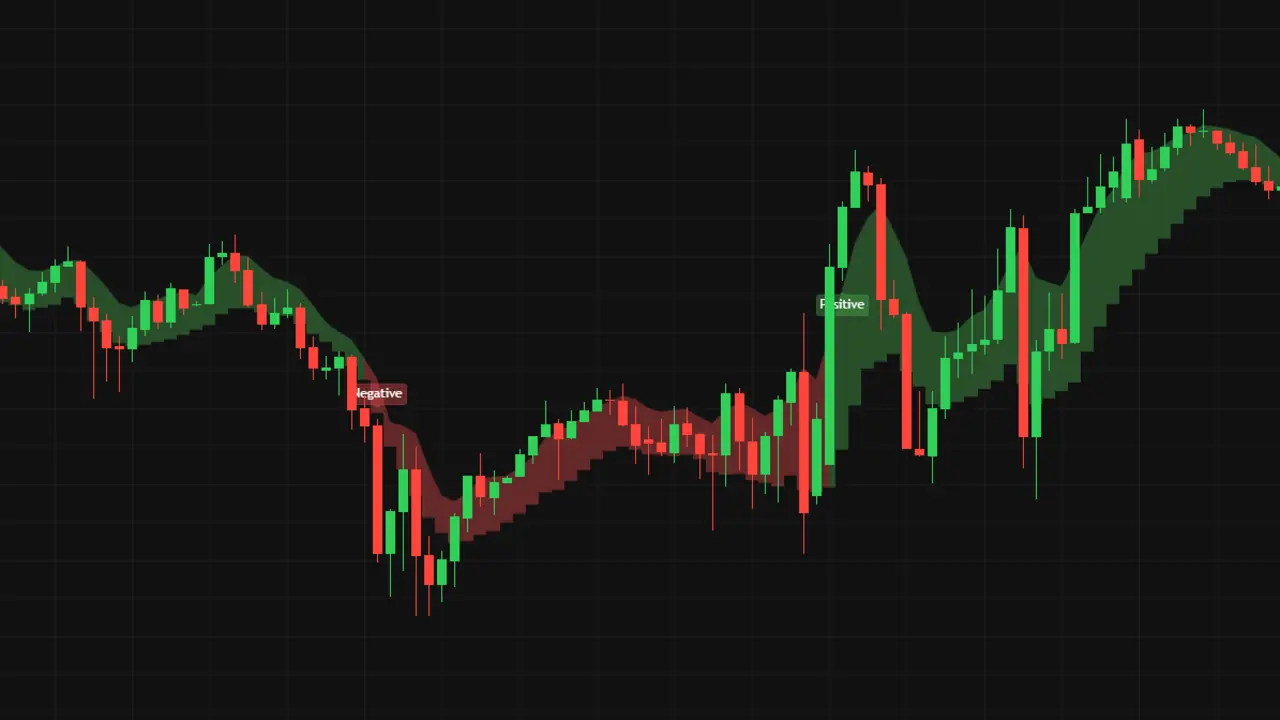
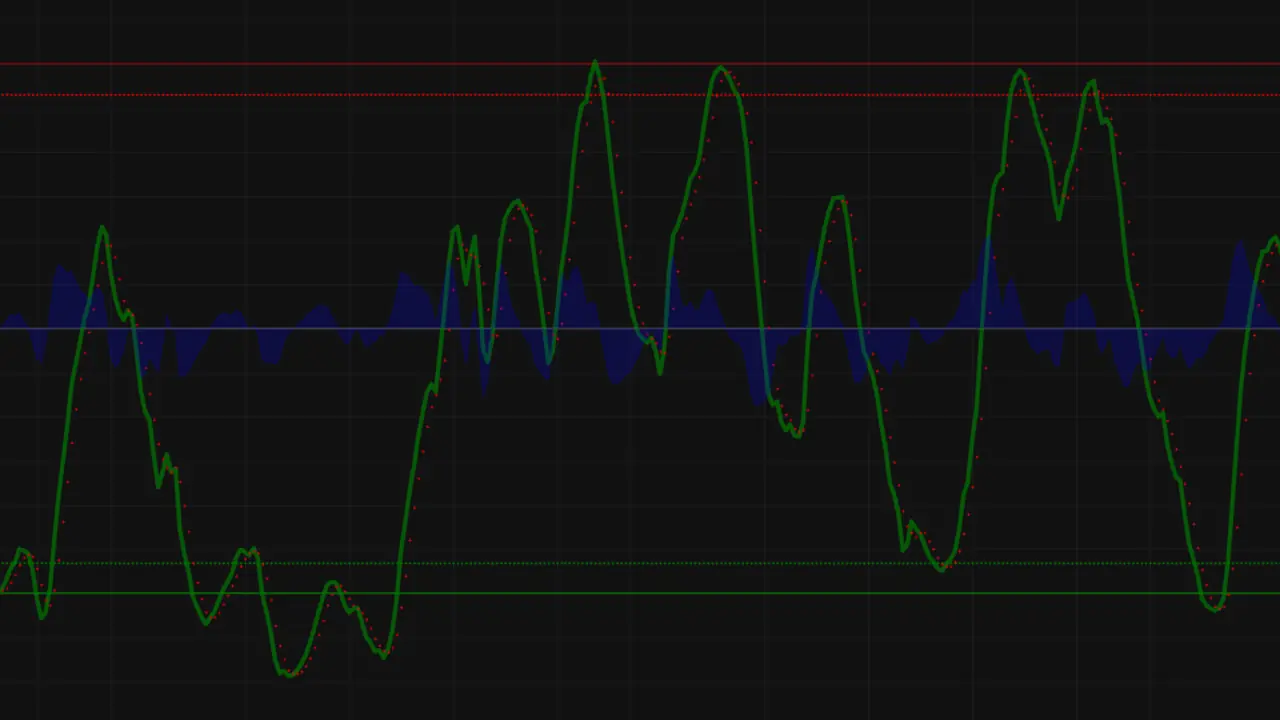
Screenshot of the NeuronAlgo Williams %R indicator page.
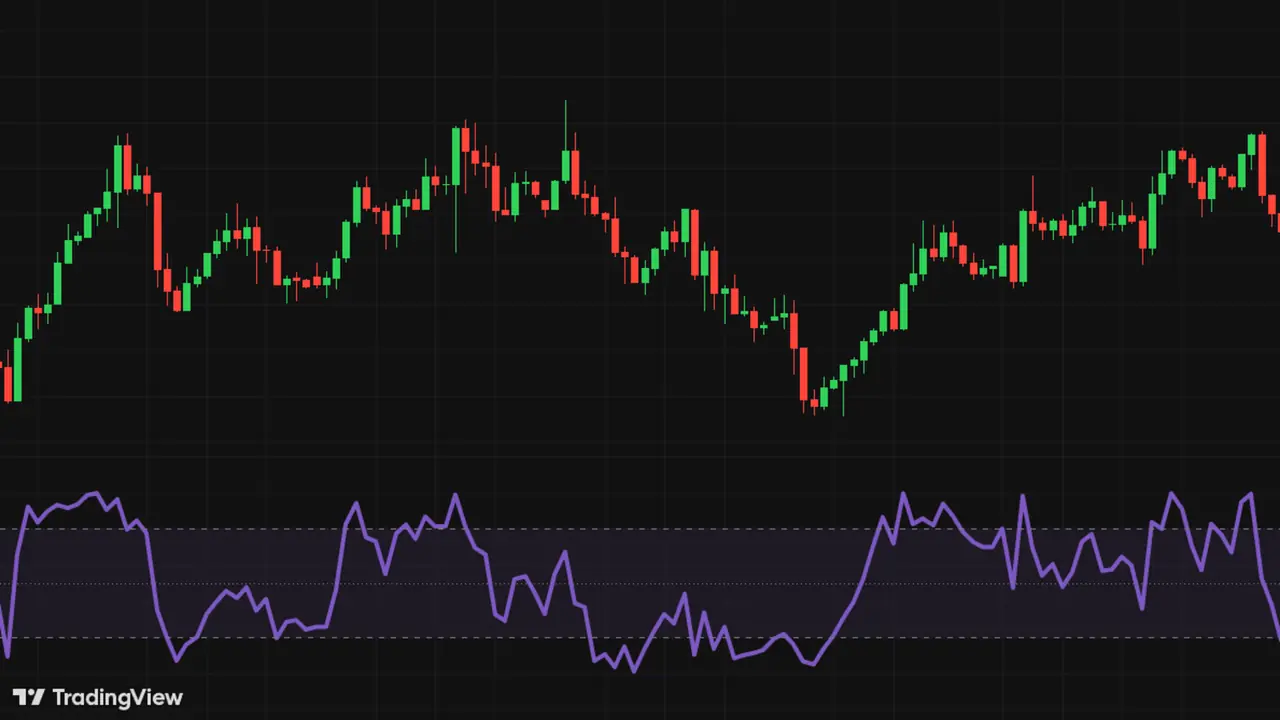
Example chart — illustrative, not a backtest.
research-profile --evidence secondary

RESEARCH PROFILE

Williams %R

Research-only Publication blocked Authoritative verdict unchanged
32/32 scopes measured

8 instruments · 4 timeframes

Lead example: USD_JPY M5 · not universal

EDITORIAL TAKEAWAY

What this research reveals

Scope sensitivity is the clearest cross-scope finding.

Williams %R showed different research results across the complete 32-scope set: a measurable association was present in 22 scopes, while 10 had no measurable association. 4 scopes showed at least one supported regime. The evidence therefore does not support one universal trading relationship.

22 of 32 scopes with measurable association
10 of 32 scopes with no measurable association
4 of 32 scopes with any supported regime

PARAMETER ROBUSTNESS

How the indicator outputs respond when tested parameters move

Unavailable

No valid public indicator-level parameter-robustness summary is available for this profile. Malformed or contradictory evidence is not rendered, and the authoritative overall verdict remains unchanged.

WHAT WAS MEASURED

A complete canonical research sweep

32/32measured scopes
8instruments
4timeframes
22 of 32scopes with measurable association
10 of 32scopes without measurable association

ASSOCIATION PROFILE

Observed association across measured scopes

Descriptive research

Association varies across measured scopes: 22 of 32 showed a measurable association, while 10 of 32 showed none.

Strong 0 Useful 13 Weak 9 None 10

The distribution describes the supplied information bands across measured scopes; it is not one universal rating for the indicator.

Scopes with a measurable association 22 of 32 scopes
Observed association range-0.061 to -0.020
Average observed association-0.0379

The average observed association summarizes the supplied measured values. It is descriptive, not a prediction score, probability, profitability score, recommendation, or indicator-quality rating.

Technical association details

IC is a descriptive association measure between the indicator output and subsequent returns. It is not a prediction score, probability, profitability measure, recommendation, or indicator-quality rating.

Exact supplied values: minimum -0.061276; maximum -0.020483; mean -0.037893409090909.

WHAT WAS NOT MEASURED OR VALIDATED

Evidence boundaries

Research-scope chart comparison Not included in this 32-scope research sweep

This Research Profile did not repeat a direct reference-chart comparison for every measured scope. The authoritative chart-match result above remains separate; not included here does not mean chart reproduction failed.

Overall market robustness Research profile without complete stability across 32 measured scopes

This is the supplied cross-scope research classification when available. Output-level parameter robustness remains a separate evidence type shown above.

Timing Not summarized across scopes

No aggregate timing conclusion is available for the full scope set.

REGIME SUPPORT

How often a market-condition threshold was supported

Across measured scopes

28 of 32 measured scopes had no supported regime.

4 of 32 measured scopes had at least one supported regime.

These supported-regime counts are evidence-threshold outcomes, not trading rules.

280 supported scopes 31 supported scopes 12 supported scopes 03–6 supported scopes

A supported regime means the existing evidence threshold was passed for that market condition. It does not establish a trading rule, recommendation, or universal behavior.

TRACEABILITY EXAMPLE

Lead example only · USD_JPY M5

Not universal
0 of 6 conditions passed the existing threshold 6 negative directional observations 0 positive directional observations 0 validated regime claims

These are descriptive directional observations for one example scope. They do not summarize all measured scopes.

View example regime details

Trending · Low

Direction Negative empirical association

Not supported
Trending · Mid

Direction Negative empirical association

Not supported

Trending · High

Direction Negative empirical association

Not supported

Ranging · Low

Direction Negative empirical association

Not supported

Ranging · Mid

Direction Negative empirical association

Not supported

Ranging · High

Direction Negative empirical association

Not supported

Trending / low

Raw effect
-0.09961
Direction
Negative empirical association
Supported
No
Validated
No
Descriptive only
Yes
Adjusted p-value
Interval
Insufficiency
Promotion threshold not met
Evidence validity
Descriptive only

Trending / mid

Raw effect
-0.095083
Direction
Negative empirical association
Supported
No
Validated
No
Descriptive only
Yes
Adjusted p-value
Interval
Insufficiency
Promotion threshold not met
Evidence validity
Descriptive only

Trending / high

Raw effect
-0.057347
Direction
Negative empirical association
Supported
No
Validated
No
Descriptive only
Yes
Adjusted p-value
Interval
Insufficiency
Promotion threshold not met
Evidence validity
Descriptive only

Ranging / low

Raw effect
-0.046463
Direction
Negative empirical association
Supported
No
Validated
No
Descriptive only
Yes
Adjusted p-value
Interval
Insufficiency
Promotion threshold not met
Evidence validity
Descriptive only

Ranging / mid

Raw effect
-0.078376
Direction
Negative empirical association
Supported
No
Validated
No
Descriptive only
Yes
Adjusted p-value
Interval
Insufficiency
Promotion threshold not met
Evidence validity
Descriptive only

Ranging / high

Raw effect
-0.032956
Direction
Negative empirical association
Supported
No
Validated
No
Descriptive only
Yes
Adjusted p-value
Interval
Insufficiency
Promotion threshold not met
Evidence validity
Descriptive only

TECHNICAL DETAILS

Coverage: 32/32 scopes · 8 instruments · 4 timeframes

Coverage describes what was measured. It does not mean every scope showed the same relationship or predictive validity.

Technical coverage details
Expected32
Measured32
CompleteYes

Instruments: AUD CAD, DE30 EUR, EUR USD, GBP JPY, GBP NZD, USD CHF, USD JPY, XAU USD

Timeframes: M5, M15, H1, H4

Explicit scope inventory: AUD CAD H1, AUD CAD H4, AUD CAD M15, AUD CAD M5, DE30 EUR H1, DE30 EUR H4, DE30 EUR M15, DE30 EUR M5, EUR USD H1, EUR USD H4, EUR USD M15, EUR USD M5, GBP JPY H1, GBP JPY H4, GBP JPY M15, GBP JPY M5, GBP NZD H1, GBP NZD H4, GBP NZD M15, GBP NZD M5, USD CHF H1, USD CHF H4, USD CHF M15, USD CHF M5, USD JPY H1, USD JPY H4, USD JPY M15, USD JPY M5, XAU USD H1, XAU USD H4, XAU USD M15, XAU USD M5

HOW TO READ THIS PROFILE

What this research does — and does not — establish

This is secondary research evidence. It adds context to the indicator page without replacing the authoritative verdict or changing publication status.

  • Not NeuronAlgo Verified; this evidence does not grant publication permission.
  • Not proof of profitability, alpha, prediction, or recommendation.
  • This research sweep did not repeat direct chart comparison across its measured scope set; the authoritative chart-match result above remains separate.
View full limitations
  • direct TradingView chart comparison was not performed for the current USD_JPY M5 market scope
  • Canonical measured coverage: 32/32. Across 32 completed certificate-backed market scopes, the report can compare measured timing, information, regime-cell, and stability behavior without changing any public gate. Lead/example research scope: USD_JPY M5 (ranking convenience only; not a universal indicator scope). On USD_JPY M5, the existing certified-implementation measurement reports a useful descriptive information band with IC -0.0613. Complete fixed-universe stability is unavailable, so this scope is not classified as stable. Measured lag is 0.00 bars; this is timing description, not a trading-quality score. No regime-specific relationship passed the existing promotion threshold; cell directions remain descriptive only. Output-level stability evidence is unavailable; no output-level robustness claim is made.
  • Implementation-certificate measurements remain research-only and cannot be promoted to the authoritative public verdict.
  • Do not describe an implementation-conformance certificate as proof of predictive power, profitability, alpha, or a trading recommendation.
  • Do not describe this certified-only market row as directly chart-conformed, NeuronAlgo Verified, or publishable.
  • not a profitability claim
  • not a causal claim
  • not prediction certainty
  • not an endorsement
  • not financial advice
  • regime cells are descriptive whole-sample conditioning, not automatically tradable filters
  • empirical association direction is not a buy/sell direction
  • Do not describe an empirical association as guaranteed profitability or prediction certainty.
  • Do not infer a buy/sell direction from the sign of an empirical association.
  • Do not treat descriptive regime cells as automatically tradable historical filters.
  • Do not describe this run as NeuronAlgo Verified.
  • Do not describe this research rank as verification, profitability, alpha, an edge, prediction certainty, or a recommendation.
  • Do not convert unsupported regime-cell directions into validated regime claims.
  • Do not use output-level stability to promote or weaken the authoritative overall stability classification.
  • Do not infer indicator semantics from the display name alone.
  • Do not describe research ranking as verified evidence or publication permission.
  • Do not treat the lead/example research scope as the overall indicator scope.
  • Do not use one stable output to promote an unstable overall research profile or research rank.
  • Do not treat this Research Profile as a new verdict or publication permission.
  • Do not interpret descriptive association as profitability, alpha, an edge, or a recommendation.
access --platformsready

$ na get williams-r

where this indicator runs, and how you get it

TradingViewPublished Pine script

Runs on TradingView, so there is nothing to install. Open the published script and add it to any chart in your account — you always load the version currently published by its author.

Open on TradingView →

professional review --guidereference

Verification model

A verdict separates reproducibility from market evidence, then asks whether that evidence remains reliable under broader checks.

  1. Chart match

    Can we reproduce the indicator’s published calculation?

  2. Evidence

    Does it show a measurable historical market relationship?

  3. Robustness

    Does that relationship survive different conditions, market series, and nearby settings?

  4. Final decision

    Verified only when the required checks finish without a blocking result.

Chart match confirms we evaluated the same indicator. It does not prove profitability. Verification depends on whether the measured relationship is reliable and robust.

Verdicts summarize historical measurements. They are not forecasts, endorsements, promises of profitability, or trading advice.

Declared specification

Declared characteristics and source metadata come from the indicator record, not from the engine verdict.

Rendering
Oscillator
Origin
Third-party

Check glossary

These checks describe different parts of the evidence process; none is a standalone claim of future performance.

Chart match
Checks whether the published chart can be reproduced closely enough for later tests to describe the same indicator; passing it does not establish profitability or verification.
Market relationship
Tests whether indicator values or changes show a statistically supported historical relationship with later returns; it is not a trading strategy or forecast.
Market conditions
Repeats relationship testing across different market conditions to show whether evidence is broad, narrow, or absent; it does not predict the next condition.
Market robustness
Applies the same settings across other market series to test whether the relationship’s direction survives; coverage describes what was tested, not how many series succeeded.
Parameter robustness
Changes nearby numeric inputs to test whether the relationship survives reasonable settings changes rather than depending on one exact configuration.
Repainting
Checks whether values on already-closed bars change after later bars arrive; historical repainting undermines the reliability of historical evidence.
Signal lag
Measures timing delay between indicator changes and price changes; lag describes timing, not predictive power.
library --indicatorsready

Explore the indicator desk

Every indicator is documented under the same spec contract. Browse the full library to compare tools across markets and timeframes.

related --indicators

$ ls ./related

others from the desk

Charts shown on this page are by TradingView. TradingView® is a registered trademark of TradingView, Inc. TradingView® has no affiliation with NeuronAlgo.

Scroll to Top